| C H A P T E R 11 |
Debugging Applications |
This chapter describes the Debugger tool (Debugger) for Java Card 3 platform application developers and how to use it as a separate tool with any Java enabled IDE. Using this tool, developers can debug their applications in any Java enabled IDE.
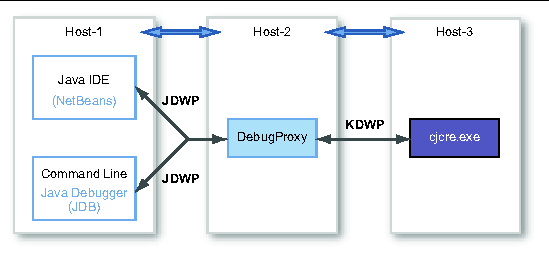
The following diagram illustrates the debugger architecture for cjcre .
FIGURE 11-1 Debugger Architecture

The Java Debug Wire Protocol (JDWP) used by the IDE is heavy for a small VM such as that provided by cjcre . Consequently, cjcre uses KVM Debug Wire Protocol (KDWP) to provide a minimum set of debugging capabilities. The debugproxy translates and sends the translated JDWP commands from the IDE to cjcre in KDWP format. Responses from cjcre are converted into JDWP format by debugproxy before it sends them to the IDE.
The communication between cjcre , debugproxy , and the IDE happens through sockets. Socket based communication enables developers to debug cjcre from remote hosts. For example, cjcre could run on machine1 , debugproxy could run on machine2 , and the IDE could run on machine3 . Developers can also run cjcre , debugproxy , and the IDE on same host.
Ports used by IDE communication to and from debugproxy and debugproxy communication to and from cjcre are distinguished by the names “listen port” and “remote port” respectively.
To fully utilize the capabilities of the Debugger, the application’s class files must be compiled with debug info. This is done by specifying the -g flag for javac when compiling the source files. These class files must be available to the debugproxy , so that the line number information can be retrieved while stepping through the code.
1. Compile the source code with -g option.
All source files must be compiled using -g option to generate the debug information in the class files. If the -g option is not used, it is not possible to set breakpoints in the source code.
2. Start debugproxy ( debugproxy.bat ) from a command line window.
The debugproxy needs to know the location of class files being debugged. When starting debugproxy , include -c (or --classpath ) option in the command to s pecify the path of the class files to be debugged.
The following is an example of a command that starts debugproxy and s pecifies myapp.war as the location of the class files to be debugged:
debugproxy.bat -c myapp.war
See Appendix C for additional details about debugger command line options.
3. Attach to the debugger from the IDE.
This procedure depends on the IDE used. For procedures required to attach the debugger to an IDE, refer to the documentation provided with the IDE.
4. Start the cjcre.exe with -debugger option.
This option enables the debugger functionality in cjcre . Without this option, debugger functionality is disabled in cjcre .
5. Set break points in the the application source code.
This procedure depends on the IDE used. The following steps are typical for all IDEs. Refer to the documentation provided with the IDE specific instructions.
a. Display the source code of the application in the IDE.
b. With the source code displayed in the IDE, open any file and set break points where required.
Break points can be set at any time, even before attaching the debugger.
6. Step through the code by executing the application from within the IDE.
When a break point is hit, the IDE stops execution and highlights the current line. Depending on the IDE being used, there are various options available to developers for stepping over or stepping into the code.
Various command line options are available to configure the debugproxy and the cjcre . See Appendix C for additional details about debugger and cjcre command line options.
Copyright © 2009 Sun Microsystems, Inc. All rights reserved.